
Why attribution model switches break your trend lines
When a major ad platform moves from last-click to data-driven attribution (DDA), your dashboards often show an instant “performance change” that isn’t a real change in demand, creative quality, or budget efficiency. It’s a measurement change. The same conversions are now being redistributed across touchpoints, and that redistribution flows straight into channel-level spend efficiency metrics like ROAS and CAC.
The problem gets worse in blended reporting: even if total conversions remain constant, the mix of credited conversions shifts across platforms. That can make your blended CAC look better or worse purely because credit moved—not because your business fundamentals changed.
What actually changes when you go from last-click to DDA
Last-click attribution assigns 100% of credit to the final tracked interaction. DDA assigns fractional credit based on patterns in the observed journeys (and the platform’s modeling). In practice, when a platform adopts DDA, you’ll typically see:
- More credit to upper-funnel and assist-like touches (prospecting, video, discovery, non-brand search), and less to pure “closers.”
- Different credit distribution by device and audience because modeled paths behave differently than click-only paths.
- A discontinuity at the switch date where historical and current periods are no longer comparable unless you normalize.
None of that is inherently “wrong.” The mistake is treating the post-switch numbers as if they’re the same measurement system as pre-switch. It’s like comparing revenue in USD last quarter to revenue in EUR this quarter and calling it growth.
How the switch distorts blended CAC and ROAS
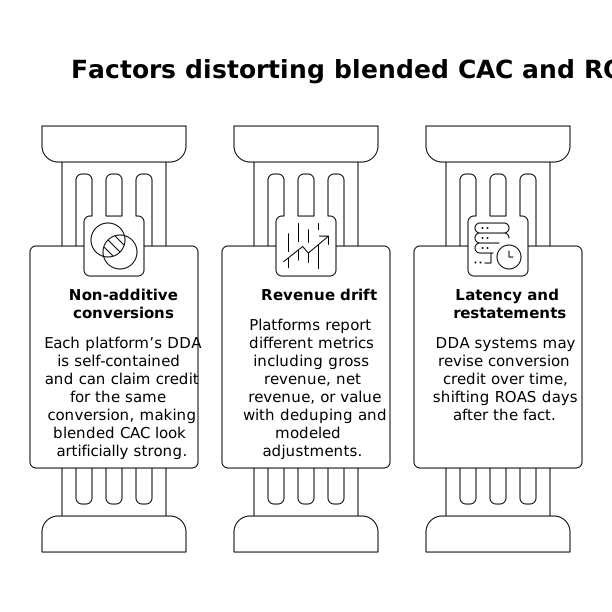
Blended CAC and blended ROAS look simple—total spend divided by total conversions or revenue—but attribution changes can still create false signals because teams rarely use truly unified definitions. A few common failure modes:
- Channel conversions become non-additive: each platform’s DDA is self-contained, and each one can claim credit for the same conversion. If you sum platform-attributed conversions, blended CAC will look artificially strong.
- Revenue definitions drift: one platform reports gross revenue, another net, another reports “value” with deduping or modeled adjustments.
- Latency and restatements increase: DDA systems may revise conversion credit over time, shifting ROAS days after the fact.
The result is a graph that appears to tell a story—“we improved efficiency” or “Meta got worse”—but what it’s really showing is an accounting rewrite.
A practical approach to keep CAC and ROAS comparable
1) Treat the switch as a measurement migration, not a performance event
Start by documenting the exact switch date and what changed: attribution window(s), click/view-through rules, modeled conversions, and the reporting field that now reflects DDA. Then add an annotation in every executive dashboard. The goal isn’t to excuse results; it’s to prevent false certainty.
2) Choose one “source-of-truth” conversion series for blended metrics
If your blended CAC/ROAS is used for budget governance, it needs a single, consistent conversion definition. For many organizations, that means basing blended metrics on first-party outcomes (CRM opportunity, closed-won, subscription activated, etc.) rather than platform-attributed conversions. This is where a dedicated measurement design for longer cycles helps—see cookie-free approaches in Cookie-Free Conversion Attribution for B2B Sales Cycles Using First-Party Events.
You can still track platform-reported DDA conversions, but treat them as platform optimization metrics, not the denominator for blended CAC.
3) Maintain two parallel views during the transition
For a defined transition period (often 4–8 weeks), maintain:
- Operational view: what platforms report now (DDA), used for in-platform bidding and creative iteration.
- Comparable view: a normalized series designed for trend continuity (often first-party conversions, or a stable attribution logic in your analytics/warehouse).
This prevents teams from “fixing” something that isn’t broken while still letting them operate with the platform’s current optimization signals.
4) Normalize with a calibration factor when you must keep platform conversions
Sometimes the business needs to keep a blended metric built from platform conversions (legacy dashboards, contractual targets, or stakeholder expectations). In that case, create a calibration approach:
- Pick a short overlap period where both attribution models can be observed (or where you can reproduce last-click-like logic from raw events).
- Compute a model shift factor per platform and conversion type (e.g., DDA conversions ÷ last-click conversions).
- Apply that factor to pre-switch or post-switch periods to create a “constant-model” series.
This doesn’t make attribution “true,” but it restores comparability—exactly what a blended CAC/ROAS trend line is supposed to provide.
5) Separate “credit” from “causality” in stakeholder language
DDA redistributes credit; it does not automatically prove incrementality. If your reporting implies causality (“this channel drove X”), you’ll need experimentation or incrementality testing to support it. Your dashboards should label DDA outputs as attributed, not incremental.
Data plumbing that prevents silent definition drift
Attribution-model switches are painful mainly because data pipelines and KPI definitions aren’t governed. You want to know, in plain terms: which fields changed, which transformations are applied, and whether two dashboards use the same math.
That’s why teams increasingly treat marketing data like production software: clear contracts, consistent naming, and testable assumptions. The same mindset behind reliable event handling and retries in Reliable Event-Driven No-Code Frontends With Idempotency Keys, Retries, and Dead-Letter Queues applies here: you don’t want “mostly correct” numbers—especially not around a model migration.
A marketing data infrastructure layer can help by standardizing metric definitions across sources, tracking transformations, and producing a consistent dataset for BI and warehousing. Funnel.io is designed for exactly this kind of cross-channel normalization—harmonizing naming, currencies, and KPIs so your blended reporting doesn’t hinge on whichever platform changed its attribution settings last.
What to monitor in the weeks after the switch
- Restatement behavior: how often conversions/revenue change for prior days, and by how much.
- Channel mix of credited conversions: watch for sudden “winner/loser” shifts that are purely allocative.
- Lag-adjusted ROAS: compare cohorts (e.g., 7-day mature ROAS) instead of same-day performance.
- First-party funnel health: leads, opportunities, activated users—signals that are independent of attribution credit.
If you anchor blended CAC/ROAS to stable definitions, treat platform DDA as an optimization signal, and enforce data governance, an attribution model switch becomes a managed migration—not a reporting crisis.